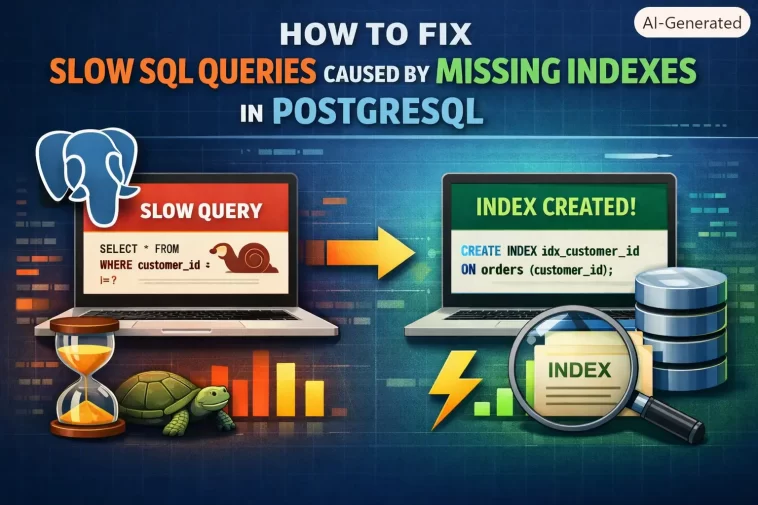
I once watched a query that used to run in 40ms creep up to 8 seconds over about six months, and nobody had touched the query itself in that whole time. If you’re dealing with slow SQL queries caused by missing indexes in PostgreSQL, the data just grew past the point where a sequential scan stayed cheap, and nothing alerted anyone until users started complaining. So let’s go through how to actually confirm that’s what’s happening, and how to fix it without just throwing indexes at every column and hoping.
This is a troubleshooting-heavy topic, so I’m going deep on diagnostics rather than just listing CREATE INDEX syntax — the syntax is the easy part.
Quick Answer
- Run
EXPLAIN (ANALYZE, BUFFERS)on the slow query and look forSeq Scanon a large table - Check
pg_stat_user_tablesfor a highseq_scancount relative toidx_scanon the table in question - Create an index on the columns used in your
WHERE,JOIN, andORDER BYclauses — usually as a composite index, not several single-column ones - Use
CREATE INDEX CONCURRENTLYin production to avoid locking the table while it builds - Re-run
EXPLAIN ANALYZEafter creating the index to confirm the planner actually picked it up — it doesn’t always, and that’s its own diagnostic path
Why Missing Indexes Cause Slow Queries
The obvious cause is right there in the title, but “missing index” actually covers a few distinct situations that get fixed differently.
No index exists on the filtered or joined columns at all. This is the straightforward case — a WHERE clause or JOIN condition on a column with zero indexes forces a full sequential scan of the table for every execution.
An index exists, but on the wrong column order for a composite query. If you’ve got an index on (status, created_at) but your query filters on created_at alone, that index is far less useful than one built with created_at leading — column order in a composite index matters a lot, and it’s one of the more overlooked causes of “I have an index but it’s not being used.”
The index exists but the planner isn’t choosing it. Stale table statistics (from ANALYZE not having run recently), a query wrapping the indexed column in a function or type cast, or the table being small enough that a sequential scan is genuinely cheaper — all of these result in an unused index even though it’s technically there.
Index bloat from heavy write activity. Frequent updates and deletes can bloat a B-tree index over time, making it slower than it should be even when it is being used. This one doesn’t show up as “missing” in an obvious sense, but the symptom looks identical from the query side.
Comparison: Common Causes and How to Confirm Each
| Cause | How to confirm | Typical fix |
|---|---|---|
| No index on filtered column | Seq Scan in EXPLAIN, high seq_scan in pg_stat_user_tables | CREATE INDEX on the column(s) |
| Wrong column order in composite index | Index exists but planner still shows Seq Scan or a full index scan | Rebuild index with correct leading column, or rely on skip scan in PG18+ |
| Stale planner statistics | ANALYZE hasn’t run recently; row estimates in EXPLAIN wildly off from actual | Run ANALYZE, check autovacuum settings |
| Function/cast wrapping the column | Query has WHERE lower(email) = ... but index is on plain email | Expression index matching the exact wrapped form |
| Index bloat | pg_stat_user_indexes shows large index size relative to row count | REINDEX CONCURRENTLY |
Not every case fits neatly into one row — sometimes it’s a stale-statistics problem sitting on top of a genuinely missing index, and you have to fix both.
Step-by-Step: Diagnosing the Actual Problem
Step 1: Get the real execution plan
sql
EXPLAIN (ANALYZE, BUFFERS) SELECT * FROM orders WHERE customer_id = 4821;On PostgreSQL 18, BUFFERS is included by default with ANALYZE, so you may not even need to specify it — but it doesn’t hurt to be explicit, especially if you’re on 17 or earlier where it’s still opt-in. Look for Seq Scan on a table with a meaningful row count. A sequential scan on a 200-row lookup table isn’t a problem; one on a 40-million-row orders table is exactly the symptom you’re chasing.
Step 2: Cross-check with table-level stats
sql
SELECT relname, seq_scan, idx_scan, n_live_tup
FROM pg_stat_user_tables
WHERE relname = 'orders';
If seq_scan is climbing steadily and idx_scan is flat or zero, that confirms the pattern isn’t a one-off — it’s happening on every query hitting this table, which is exactly what you’d expect from a genuinely missing index rather than a fluke plan choice.
Step 3: Check if an index already exists but isn’t being used
sql
SELECT indexname, indexdef FROM pg_indexes WHERE tablename = 'orders';If an index does exist on the relevant column and the planner still isn’t using it, that’s a different problem than a missing index — jump to the “Why the Planner Skips an Existing Index” section below rather than creating a duplicate one.
Step 4: Create the index
For a single filtered column:
sql
CREATE INDEX CONCURRENTLY idx_orders_customer_id ON orders (customer_id);For queries filtering on multiple columns together, build a composite index matching the actual query pattern:
sql
CREATE INDEX CONCURRENTLY idx_orders_customer_status ON orders (customer_id, status);Always use CONCURRENTLY on a production table with any meaningful write traffic. Without it, CREATE INDEX takes a lock that blocks writes for the entire build — on a large table that can be minutes of blocked inserts and updates, which is its own outage.
Step 5: Re-run EXPLAIN ANALYZE to confirm the new plan
Don’t skip this. So run the exact same query again and confirm you now see an Index Scan or Index Only Scan where there used to be a Seq Scan. Creating the index isn’t the finish line — confirming the planner actually adopted it is.
What Actually Worked For Me
That 40ms-to-8-second query I mentioned — my first instinct was that something had changed in the application code generating the query, since that felt more likely than “the table just got big.” Spent a while checking recent deploys and ORM query logs. Nothing had changed there at all.
It was genuinely just table growth past a threshold where the planner’s cost estimate for a sequential scan flipped from “cheaper” to “much more expensive,” combined with an index that existed but had the columns in the wrong order for how the query was actually filtering. Rebuilding the index with the correct leading column dropped it back to single-digit milliseconds immediately.
Adding indexes to every column that appears anywhere in a WHERE clause is the fix most commonly recommended, and it’s rarely the right move at scale — it slows down every write to the table (each index has to be maintained on every insert/update) and bloats storage, often without meaningfully helping the specific slow query you’re chasing. Composite indexes matched to actual query patterns usually beat a pile of single-column ones.
Why the Planner Skips an Existing Index
Stale statistics. If ANALYZE hasn’t run recently (check last_analyze and last_autoanalyze in pg_stat_user_tables), the planner’s row estimates can be far enough off that it picks a sequential scan even with a perfectly good index available. Run ANALYZE orders; manually and re-test.
A function or type cast wrapping the column. WHERE lower(email) = '[email protected]' won’t use a plain index on email — Postgres needs an expression index that matches the exact wrapped form: CREATE INDEX ON users (lower(email));
The table (or the matching subset of rows) is genuinely small. If a query only ever touches a few hundred rows out of a huge table because of a highly selective filter elsewhere, the planner might reasonably decide a sequential scan of that subset is cheaper than an index lookup — this isn’t always a bug.
Column order mismatch in a composite index, pre-PostgreSQL 18. Versions before 18 generally required the leading column of a composite index to be part of the filter for the index to be useful. PostgreSQL 18 introduced skip scan support for multicolumn B-tree indexes, which lets some queries use a composite index even when they don’t filter on the leading column — worth checking your Postgres version before assuming a rebuild is the only option.
Advanced Fixes and Edge Cases
Partial indexes for highly skewed data. If 95% of queries only care about WHERE status = 'active', a partial index — CREATE INDEX ON orders (customer_id) WHERE status = 'active'; — is smaller, faster to maintain, and often outperforms a full index covering rows nobody queries.
Covering indexes with INCLUDE. If a query selects a few extra columns beyond what it filters on, adding them via INCLUDE can produce an Index Only Scan that avoids touching the table heap at all: CREATE INDEX ON orders (customer_id) INCLUDE (order_total, created_at);
GIN indexes for JSONB or full-text columns. A standard B-tree index won’t help queries filtering inside a JSONB column or doing text search — those need GIN (or GiST for some geometric/full-text cases) instead.
BRIN indexes for large, naturally-ordered time-series tables. For append-heavy tables ordered roughly by insertion time (like log or event tables), a BRIN index is dramatically smaller than a B-tree and often fast enough, at a fraction of the storage cost.
Index bloat from heavy churn. Check index size against expected size with pg_stat_user_indexes and pg_relation_size. If it looks disproportionately large, REINDEX CONCURRENTLY rebuilds it without the exclusive lock a plain REINDEX requires.
Prevention Tips
- Set up
pg_stat_statementsso you can find your actual slowest queries by total time, not just the ones someone happened to notice - Run
ANALYZEregularly, or confirm autovacuum’s analyze threshold settings are reasonable for your write volume - Review new indexes for real query patterns before adding them — match the actual
WHERE/JOIN/ORDER BYcombination, not just “this column shows up somewhere” - Periodically check for unused indexes (
idx_scan = 0inpg_stat_user_indexesover a meaningful time window) and consider dropping them — every index has a write cost
FAQ
Does adding an index always make queries faster? No. It speeds up the reads it’s designed for but adds overhead to every write on that table, and an unused or poorly targeted index is pure cost with no benefit.
Why did my query get slower right after I added an index? Occasionally the planner picks the new index for a query where it’s actually worse than the plan it was already using — this is rare, but re-run EXPLAIN ANALYZE and compare if you see this.
Is CREATE INDEX CONCURRENTLY always safe to use? It avoids the write-blocking lock, but it can fail partway through and leave an invalid index behind, which you’d need to drop and retry. Check pg_indexes afterward if you’re not sure it completed.
How often should I run ANALYZE manually? If autovacuum is configured reasonably, you often don’t need to at all. But after bulk loads or large deletes, running it manually right away avoids a window of bad statistics.
Do I need a DBA to do all this? Not usually, for a single slow query. This level of diagnosis is well within reach for most backend developers — it gets harder at the point where you’re tuning planner cost constants or dealing with replication-wide index strategy.
Editor’s Opinion
the column order thing in composite indexes trips up more ppl than actual “no index exists at all” scenarios, from what ive seen. ppl create the index, see it exists, assume job done, then never check if postgres is actually using it. always re-run explain analyze after, its 2 seconds and it saves you from a false sense of security.
