I hit a breakpoint that just sat there greyed out, no variable values, no call stack worth anything, and the little hollow circle telling me symbols weren’t loaded. My first instinct was to blame a corrupted install and consider reinstalling Visual Studio entirely. That would’ve been a massive waste of time — the actual cause was a debug build pointing at a release DLL, which is a much smaller fix than it sounds like at first.
Quick Answer
- Check the Modules window (Debug > Windows > Modules) to see exactly which .pdb file is loaded and from where
- Confirm you’re actually debugging a Debug build, not Release — mismatched builds are the most common cause
- Disable “Just My Code” temporarily if you need to step into optimized or third-party code
- Verify the .pdb isn’t stripped — stripped PDBs load fine but contain no source mapping
- Use Load Symbols manually and browse to the correct output folder if automatic loading picks the wrong file
Why Symbols Fail to Load
This isn’t usually a broken installation. It’s almost always a mismatch somewhere between what got built and what the debugger is actually looking at.
Debug vs Release mismatch is the single most common cause. The debugger will happily attach to a Release build if that’s what’s actually running, and Release builds are optimized in ways that either strip debug info or make it unreliable. So if your toolbar says Debug but the actual module loaded comes from a Release output path, you’ll get exactly this symptom — no symbols, or symbols that don’t line up with your source.
The PDB has to match the binary exactly, not just be present. Visual Studio doesn’t just check if a .pdb file exists next to the DLL — it verifies the PDB was built from that exact compilation. If you rebuilt the project after the PDB was generated, or you’re loading an old cached PDB, the debugger will treat it as missing rather than using a stale one. This exact-match requirement is honestly the source of most “but the file’s right there” confusion.
“Just My Code” silently skips symbol loading for anything it considers external. If this option’s enabled, Visual Studio deliberately doesn’t load symbols for optimized modules or code outside your project, even if perfectly good PDBs exist for them. It’s meant to keep you from accidentally stepping into framework internals, but it produces the exact same visual symptom as symbols genuinely being missing.
There’s a less obvious cause too: stripped PDBs. A PDB built with the /PDBSTRIPPED linker option loads without error but contains no source file mapping at all. So the debugger reports symbols as loaded, but you still can’t see your source lines — which looks like a different bug entirely until you know to check for this specifically.
Where This Shows Up Most
Third-party library debugging hits this constantly, since you often need external .pdb files that match the exact build of a DLL you didn’t compile yourself, and Microsoft’s public symbol servers only cover system and framework DLLs, not arbitrary third-party code.
VSIX extension development in newer Visual Studio versions has a known pattern where the experimental instance loads the installed extension from Program Files while symbols resolve from an old Release obj folder, producing a debug session that looks connected but never actually breaks correctly.
Remote debugging setups add another layer, since by default PDB files are read from the Visual Studio machine itself, not the remote server, which catches people who assume the server-side PDB is what matters.
Cause Comparison Table
| Symptom | Likely Cause | Fix |
|---|---|---|
| No symbols loaded at all | Debug/Release mismatch | Check Modules window, confirm active configuration |
| Symbols loaded, breakpoint still not hit | Just My Code enabled | Disable it in Tools > Options > Debugging |
| Symbols loaded, no source line info | Stripped PDB | Rebuild without /PDBSTRIPPED, or accept it’s optimized code |
| symsrv.miss.txt file present | Symbol server can’t find matching PDB | Check symbol server path and internet access |
| Wrong .pdb loaded | Cached or stale symbol path | Manually browse and load the correct file |
Step-by-Step Fixes
Step 1: Open the Modules window during a debug session. Debug > Windows > Modules while paused at a breakpoint. Look at the Symbol Status column — it’ll tell you directly whether symbols are loaded, skipped, or not found, and the Symbol File column shows exactly which .pdb path is in use.
Step 2: Confirm you’re actually running a Debug build. Check the configuration dropdown in the toolbar, but don’t stop there — verify in the Modules window that the loaded DLL path actually points to your Debug output folder, not a Release or installed-extension path. These can silently diverge, especially in extension or multi-project solutions.
Step 3: Right-click the module and select Load Symbols. This forces a manual reload from your configured symbol locations rather than relying on whatever the debugger auto-resolved.
Step 4: Browse manually if automatic loading fails. Right-click the module, choose Load Symbols, then Browse and navigate directly to the correct Debug output folder to select the matching .pdb by hand.
Step 5: Check and adjust Just My Code. Go to Tools > Options > Debugging > General and uncheck “Enable Just My Code” if you specifically need to step into optimized or external code that has valid symbols available.
Step 6: Verify symbol server paths under Tools > Options > Debugging > Symbols. Make sure any custom symbol server paths are correct and reachable, and that Debug output folders for your own projects are listed above any Release or shared cache paths, so they get searched first.
Step 7: Delete and rebuild if you suspect corruption. If the PDB is only partially corrupted, delete it and do a full clean rebuild of that specific module rather than an incremental build, since incremental builds sometimes don’t regenerate a fully fresh PDB.
What Actually Worked For Me
I initially assumed a corrupted PDB cache and cleared the whole local symbol cache folder, which did nothing — the symptom was identical afterward. What actually fixed it was checking the Modules window like I probably should have from the start, where I noticed the DLL path clearly said obj\Release\ instead of obj\Debug\. A leftover build configuration setting from a copy-pasted project file was quietly building Release even though the IDE toolbar said Debug.
That one was a genuinely quick fix once I found it, and I’ll admit it was more luck than method that I even opened the Modules window — I’d been about to reinstall Visual Studio entirely before a coworker mentioned checking there first. Not every symbol issue resolves that cleanly, though. I’ve also had cases involving third-party DLLs where no amount of manual symbol path configuration helped, simply because the vendor never shipped a matching PDB at all, and there wasn’t a fix beyond decompiling or living without deep stepping into that code.
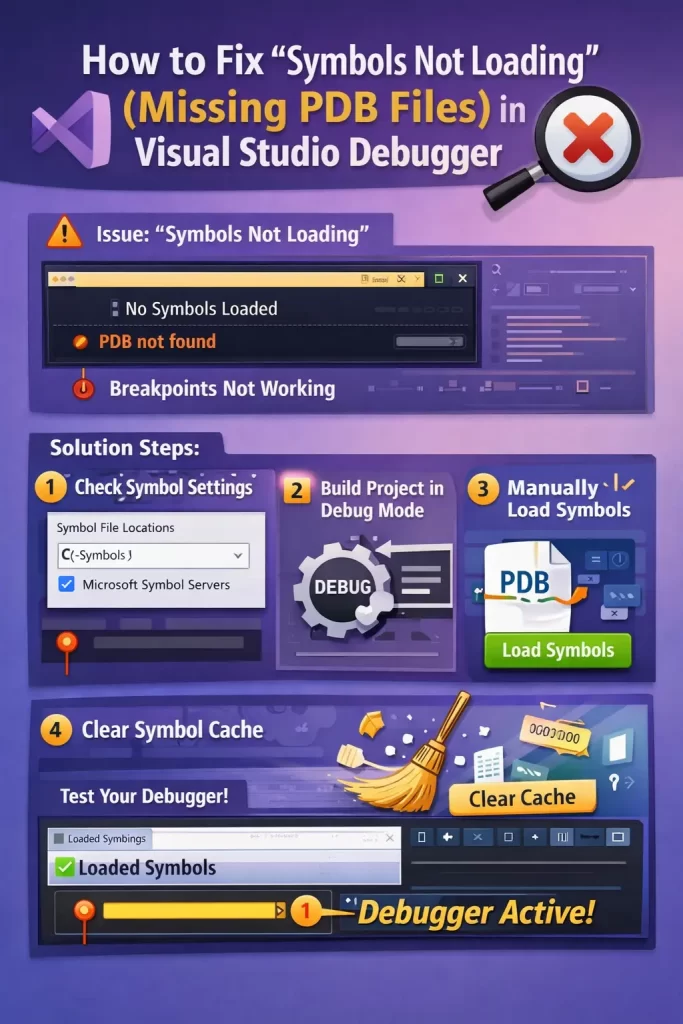
Advanced Fixes and Edge Cases
Symbol server miss files tell you exactly what failed. If a folder contains a file like symsrv.miss.txt, open it — it usually lists the exact URL the debugger tried and failed to reach, which is far more useful for diagnosing network or path issues than guessing blind.
Extension debugging in newer Visual Studio versions needs explicit path ordering. For VSIX extensions specifically, remove or deprioritize any symbol paths pointing at Release output, add the Debug output folder explicitly, and make sure it’s ordered above shared or Release paths in the symbol locations list.
“Always Load Automatically” saves you from repeating manual fixes. Once you’ve manually loaded the correct .pdb for a stubborn module, right-click it again and choose “Always Load Automatically” so future debug sessions don’t require repeating the same manual browse step.
Prevention Tips
Keep Debug and Release output paths clearly separated in your project structure so a misconfigured build setting is easy to spot in the Modules window rather than hidden behind identical folder names. Avoid clearing your local symbol cache as a first troubleshooting step — it rarely fixes the underlying mismatch and just means Visual Studio has to re-download everything. And when working with third-party libraries, check early whether the vendor actually publishes matching PDBs at all, so you’re not troubleshooting a problem that has no available fix.
FAQ
Why does the debugger say “Skipped loading symbols” instead of an error? That specific message usually means Just My Code is enabled and the module is considered optimized or external — check that setting before assuming the PDB itself is broken.
Do I need internet access for symbols to load? Only if you’re relying on Microsoft’s public symbol servers for system DLLs. Your own project’s PDBs load locally from the build output and don’t need any network access.
Can a rebuild fix a “symbols don’t match” error? Usually yes, since a clean rebuild regenerates a PDB that matches the current binary exactly. An incremental build sometimes isn’t enough if the mismatch is subtle.
Is it normal for third-party DLLs to have no available symbols? Yes, very common. Not every vendor publishes PDBs, and without one there’s no way to get full source-level debugging into that code.
Editor’s Opinion
check the modules window before you do anything else, seriously. i wasted way more time assuming installation corruption than the actual fix took once i looked in the right place. also just my code is one of those settings that quietly changes your whole debugging experience and most people never touch it after the default install, worth knowing it exists.
