First time I tried remote debugging, I spent almost an hour convinced my network was broken because Visual Studio kept saying it couldn’t find the remote debugger — turned out I’d installed a newer Remote Tools version than my actual Visual Studio install, and they just don’t talk to each other. Version mismatches like that are honestly the most common thing tripping people up here, more than anything actually network-related.
Quick Answer
- Download Remote Tools matching your exact Visual Studio version — 2022 and 2026 remote tools are cross-compatible, but earlier versions aren’t
- Run msvsmon.exe on the remote machine to start the Remote Debugging Monitor
- Copy your Debug build output to the remote machine and launch the app there before attaching
- In Visual Studio, use Debug > Attach to Process, set Connection Type to Remote, and enter the remote machine’s name
- Open the correct firewall ports on the remote machine if the connection fails to establish
Understanding What You’re Actually Setting Up
Remote debugging connects your local Visual Studio instance to a .NET application running on a different machine, letting you set breakpoints and inspect variables exactly like you would locally, just with the code physically executing somewhere else. This matters for testing on production-like environments, checking behavior on IIS servers, or debugging on Azure VMs, where you can’t just run the debugger directly.
The tool that makes this work is called msvsmon.exe, and it runs on the remote machine, listening for a connection from your development machine’s Visual Studio instance. It’s not something you install into your project — it’s a standalone utility you either install via the Remote Tools package or copy directly onto the target machine.
Why Setup Commonly Fails
Version mismatches are the single biggest cause of connection failures. The remote debugger version on the target machine has to match your local Visual Studio version, with one specific exception — Remote Tools for both Visual Studio 2022 and 2026 are cross-compatible with each other. Anything older than that isn’t, so if you’re running Visual Studio 2019 locally, you need the 2019-specific remote tools, not a newer package.
Firewall rules block the connection more often than people expect. msvsmon needs specific inbound ports open on the remote machine, and if the app’s normal traffic already flows fine but the debugger connection specifically fails, an unopened port is the first thing to check.
Forgetting to actually build and deploy a Debug configuration is an easy miss. Remote debugging needs a Debug build with full symbol information, copied over to the remote machine and running there before you attach. Attaching to a Release build that’s already running won’t give you the breakpoint behavior you’re expecting, since optimized code doesn’t map cleanly back to your source.
There’s a permissions-related cause too that catches people off guard: running the remote debugger under a different user account than the one active on your Visual Studio machine. If the accounts don’t match, you need to explicitly add permissions for the other account, either through the remote debugger’s Tools > Permissions menu or by starting it with the /allow <username@computer> command-line switch.
Remote Debugging Scenarios Compared
| Scenario | Setup Complexity | Notes |
|---|---|---|
| Local network machine, same domain | Low | Usually just needs matching remote tools version and firewall rule |
| IIS-hosted ASP.NET/.NET Core app | Medium | Uses Attach to Process rather than launching directly |
| Azure VM | Medium-High | Same core process as IIS, plus network/NSG rules on the Azure side |
| Cross-region or high-latency connection | Not recommended | Microsoft explicitly advises against remote debugging over high-latency or long-distance connections |
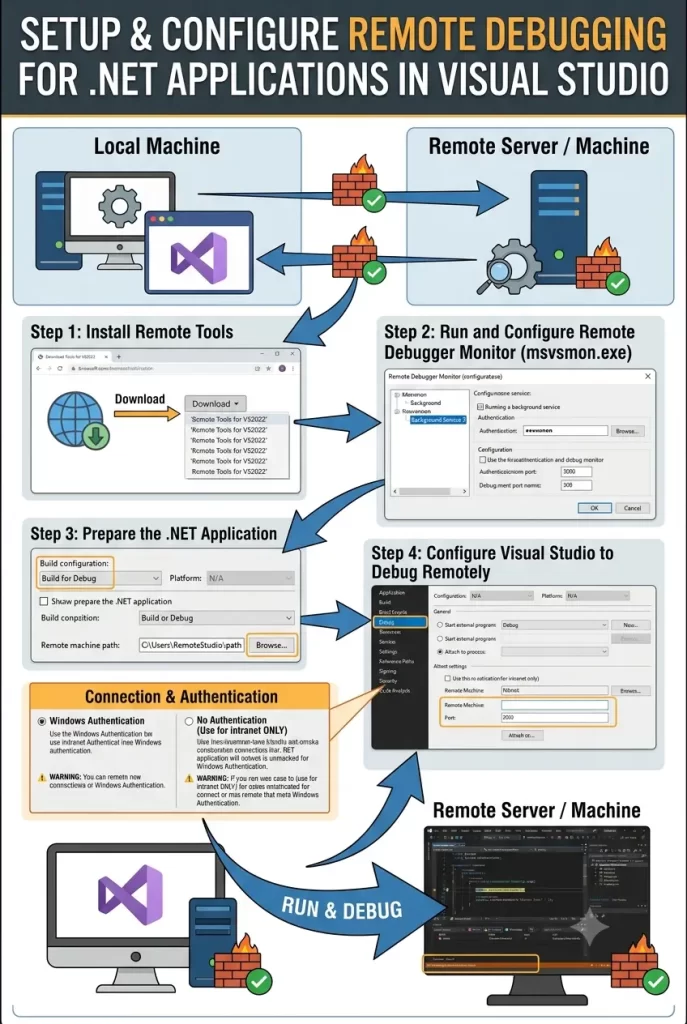
Step-by-Step: Setting Up Remote Debugging
Step 1: Download the matching Remote Tools package. Get the Remote Tools version that corresponds to your Visual Studio version. Remember, 2022 and 2026 remote tools work interchangeably with either version, but anything earlier requires an exact match.
Step 2: Install or copy msvsmon.exe to the remote machine. You can either run the full Remote Tools installer on the target machine, or just copy the msvsmon.exe file directly if you don’t need the configuration wizard for running it as a service.
Step 3: Launch the Remote Debugger on the target machine. Run msvsmon.exe. On first launch, you’ll get a configuration prompt covering Windows Firewall settings — let it configure the firewall rules automatically if you’re not managing them manually elsewhere.
Step 4: Note the connection details shown in the Remote Debugger window. Once running, msvsmon displays the server name and port it’s listening on. You’ll need this exact information back in Visual Studio.
Step 5: Build a Debug configuration of your application. Back on your development machine, make sure you’re building Debug, not Release, since Release builds strip or alter the debug information needed for meaningful breakpoints.
Step 6: Copy the Debug build output to the remote machine. Move the relevant files from your local bin\Debug folder to wherever the app needs to run on the target machine, and launch it there.
Step 7: Attach from Visual Studio. Open your solution locally, go to Debug > Attach to Process (Ctrl+Alt+P), set Connection Type to Remote, and enter the remote machine’s name or address as shown in the Remote Debugger window. Select the running process and attach.
Step 8: Set your breakpoints and start debugging. Once attached, breakpoints in your local source should hit exactly as they would in a local debug session, assuming the deployed binaries match your local source and PDBs.
What Actually Worked For Me
My first real attempt failed with a fairly unhelpful error saying the remote debugging monitor didn’t appear to be running, even though I could clearly see msvsmon’s window open and waiting on the other machine. I spent a while assuming it was a network name resolution issue and tried IP addresses instead of computer names, which didn’t help either.
The actual cause, once I dug into it, was that I’d grabbed whatever Remote Tools download came up first in search results without checking it matched my Visual Studio version. Reinstalling the correctly matched version fixed the connection immediately. It’s a boring answer, but checking version compatibility first would’ve saved me the better part of an hour of chasing network theories that had nothing to do with the actual problem.
Advanced Fixes and Edge Cases
Running the remote debugger as a persistent service avoids needing to manually launch msvsmon every time. This requires installing the full Remote Tools package (not just copying the exe) so the Remote Debugger Configuration Wizard (rdbgwiz.exe) is available to set it up as a Windows service.
Debugging managed code symbols remotely sometimes needs an extra flag. The /FallbackLoadRemoteManagedPdbs command-line switch tells msvsmon to fall back to remote symbol locations for managed code specifically, useful when local symbol resolution isn’t finding what it needs.
ARM64 targets need the matching architecture build of msvsmon. If you’re debugging an x64 app running on an ARM64 operating system, you specifically need the x64 msvsmon.exe that ships with the ARM64 remote tools package, not the ARM64-native version.
Authentication mode matters more than it seems. No Authentication mode is available and does simplify setup, but Microsoft explicitly discourages it outside of fully trusted, isolated networks, since it removes network-level security from the debugging connection entirely.
Prevention Tips
Always confirm the Remote Tools version before installing, rather than grabbing the first download link that comes up — a five-second version check avoids the exact mismatch headache that ate my first attempt. Keep firewall configuration consistent by letting the Remote Debugger Configuration wizard handle it automatically where possible, rather than manually guessing which ports to open. And avoid attempting remote debugging over genuinely high-latency connections, like debugging across countries — Microsoft’s own guidance flags this as likely to fail or be too slow to be usable anyway.
FAQ
Can I remote debug without installing anything on the target machine? Yes, copying just msvsmon.exe works for basic scenarios, though you lose access to the configuration wizard needed for running it as a service.
Does remote debugging work over the public internet? Technically possible on a low-latency connection, but Microsoft doesn’t recommend it for anything with meaningful distance or latency between machines — it’s designed primarily for local networks.
Why does Attach to Process show a different dialog than tutorials I’m reading? The Attach to Process dialog changed starting in Visual Studio 2022 version 17.10 Preview 2. If a guide shows an older layout, it’s likely written for pre-17.10 versions.
Do I need administrator privileges to set up remote debugging? You need admin rights specifically to grant or deny permissions for other user accounts in the remote debugger, though running it under your own matching account doesn’t require elevated privileges.
Editor’s Opinion
the version matching thing feels like it should be flagged way more obviously somewhere in the download page, i genuinely didnt know it mattered until it broke my setup. otherwise once its actually connected the whole thing just works like local debugging, which is honestly kind of satisfying the first time you get it right.
